BEFRA SECOND QUARTER 2024 EARNINGS RELEASE
Published on July 25, 2024
Exhibit 99.1


Message from the Chairman
BeFra demonstrated steady and encouraging growth once again this quarter, with net revenue increasing 5.3% and 8.0% in Q2 2024 and H1 2024, respectively. The positive net revenue trend was consistent across all business units, reflecting more balanced growth and underscoring the effectiveness of our strategic growth initiatives and commercial excellence. The revenue growth also demonstrates the strength of BeFra’s business model and evidences sustainable expansion, establishing a strong foundation for continued success this year and beyond. We expect to achieve our 2024 guidance for EBITDA as well as revenue, as our seller base expands, and average order sizes continue growing.
Betterware Mexico maintained its positive trajectory with a 2.2% and 7.0% YoY increase in net revenue for the second quarter and first-half, respectively. This marked the third consecutive quarter of growth and indicates a solid recovery in post-pandemic momentum. The growth also reflects higher productivity levels resulting from initiatives that enable our associates to focus more on selling.
Jafra Mexico’s performance remained strong, with revenue growing 9.0% and 10.1% YoY in Q2 2024 and H1 2024, respectively, while EBITDA increased 28.2% and 33.2% during the same periods, all of which underscores our improving commercial and operational efficiencies that are enabling us to effectively harness the beauty market’s rapid growth.
Jafra US achieved a significant milestone in the second quarter, with YoY revenue growth turning positive for the first time since the acquisition. Revenue grew 1.2% in pesos and a 4.4% in USD, as a result of the turnaround plan that we have implemented since we acquired the company and led by this unit’s new leadership team. Its strengthening recovery combined with the solid growth of the Mexican business, means Jafra remains a highly accretive acquisition. It has also diversified BeFra in terms of revenues and geography, enhanced our growth profile, and made us a more resilient company overall.
For over two decades, we have consistently achieved, on average, more than 20% growth in net revenue and profitability. Our asset-light business model, with a small percentage of fixed costs, provides exceptional operating flexibility that helps ensure long-term, accretive growth and that has relatively low capital requirements. Our strategy and focus remain on long-term performance that offers substantial returns to our stockholders, in terms of growth and yield. For perspective, since going public in March 2020, Betterware has doubled in size, and with the acquisition of Jafra our business has grown almost fourfold, while EBITDA for the Group has increased by over threefold.
Although increasing household penetration and share of wallet in Mexico remain our near and medium-term priority, we are beginning to expand more internationally, targeting the home solutions segment of the large and rapidly growing US Hispanic market and laying the groundwork to enter Peru. We endeavor to replicate our success in these geographies while further diversifying BeFra and extending our leadership in direct selling. Thank you for supporting us on this exciting journey.
Luis G. Campos
Chairman of the Board

2
Q2 2024 Select Consolidated Financial Information
| Q2 | H1 | |||||||||||||||||||||||
| 2024 | 2023 | 2024 | 2023 | |||||||||||||||||||||
| Net Revenue | $ | 3,389,393 | $ | 3,220,097 | +5.3 | % | $ | 6,991,896 | $ | 6,484,308 | +7.8 | % | ||||||||||||
| Gross Margin | 72.2 | % | 73.3 | % | -103 | bps | 72.9 | % | 73.0 | % | -7 | bps | ||||||||||||
| EBITDA | $ | 656,136 | $ | 717,433 | -8.5 | % | $ | 1,411,526 | $ | 1,371,992 | +2.9 | % | ||||||||||||
| EBITDA Margin | 19.4 | % | 22.3 | % | -292 | bps | 20.2 | % | 21.2 | % | -97 | bps | ||||||||||||
| Free Cash Flow | $ | 458,437 | $ | 755,735 | -39.3 | % | $ | 818,092 | $ | 1,305,047 | -37.3 | % | ||||||||||||
| Net Income | $ | 300,768 | $ | 258,370 | +16.4 | % | $ | 594,938 | $ | 446,366 | +33.3 | % | ||||||||||||
| EPS | $ | 8.06 | $ | 6.92 | +16.4 | % | $ | 15.94 | $ | 11.96 | +33.3 | % | ||||||||||||
| Net Debt / EBITDA | 1.80 | x | 2.02 | x | 1.80 | x | 2.02 | x | ||||||||||||||||
| Interest Coverage | 3.22 | x | 2.65 | x | 3.22 | x | 2.65 | x | ||||||||||||||||
| Associates | ||||||||||||||||||||||||
| Avg. Base | 1,176,458 | 1,209,573 | -2.7 | % | 1,195,950 | 1,220,266 | -2.0 | % | ||||||||||||||||
| EOP Base | 1,149,990 | 1,210,993 | -5.0 | % | 1,149,990 | 1,210,993 | -5.0 | % | ||||||||||||||||
| Distributors | ||||||||||||||||||||||||
| Avg. Base | 65,752 | 61,719 | +6.5 | % | 64,560 | 60,929 | +6.0 | % | ||||||||||||||||
| EOP Base | 65,810 | 62,462 | +5.4 | % | 65,810 | 62,462 | +5.4 | % | ||||||||||||||||
| ● | Net revenue growth. Consolidated net revenue increased by 5.3% and 7.8% YoY in the quarter and semester respectively, driven by sustained commercial strategy success in all three business units. The Company expects to continue strengthening its growth trajectory to achieve its goals in H2 2024. More details can be found within the below section for each respective business unit. |
| ● | EBITDA Margin slightly below expectations. Q2 2024 EBITDA margin was 19.4%, adversely impacted by Betterware Mexico’s temporary gross margin contraction. It is important to note that Q2 2023 22.3% EBITDA margin was favorably impacted by the USD/MXP exchange rate. Notably, H1 2024 EBITDA increased by 2.9% YoY, with margin recovery expected in the coming quarters in line with historic levels and guidance for 2024. |
| ● | Free Cash Flow (FCF) generation aligned with historical levels. Q2 2024 FCF represented 70% of EBITDA for the quarter, consistent with prior quarters. The YoY decline was due to extraordinary cash generation in the Q2 2023 which represented 105% of Q2 2023 EBITDA, primarily due to an extended supplier payment period at Jafra Mexico which increased from 30 to 120 days in 2023 and which returned to normalized levels in 2024. Q2 2024 CAPEX increased by Ps. 64M due to increased investments during the quarter including software development and Jafra Mexico’s new office fit-out. |
| ● | EPS growth. Q2 2024 EPS increased by 16% YoY and by 33% YoY for H1 2024, primarily due to a decrease in net financing cost. BeFra remains focused on an improved cost of capital with continued balance sheet deleveraging. |
For more details, please refer business unit results.
3
Balance Sheet Strength and Financial Performance
Ended Q2 2024 with Strong balance sheet.
| - | Further strengthened BeFra balance sheet in Q2 2024, providing greater financial flexibility to reduce debt leverage, invest in growth and efficiency initiatives, and pay dividends. |
Key financial metrics:
BeFra’s key financial metrics highlight robust Q2 2024 performance, reflecting a highly profitable profile and an outstanding track record of growth. The Company achieved an impressive CAGR of 23.0% in net revenue and 24.5% in EBITDA in the 2001 to 2023 period.
Liquidity ratios
Sustained strength in cash flow generation:
| Q2 2024 | Q2 2023 | ∆ | ||||||||||
| Current Ratio | 1.03 | 1.06 | -2.8 | % | ||||||||
| FCF / EBITDA | 70.0 | % | 105.3 | % | -3,545 | bps | ||||||
| CCC (days) | 42 | 71 | -29 | |||||||||
Asset Light Business
Asset light business model enables flexibility to adapt to challenging conditions.
| Q2 2024 | Q2 2023 | ∆ bps | ||||||||||
| Fixed Assets / Total Assets | 26.5 | % | 25.6 | % | +90 | |||||||
| Variable Cost Structure | 76.7 | % | 69.2 | % | +750 | |||||||
| Fixed Cost Structure | 23.3 | % | 25.8 | % | -250 | |||||||
| SG&A / Net Revenues | 51.0 | % | 49.1 | % | +170 | |||||||
Profitability
Consistent profitability.
| Q2 2024 | Q2 2023 | ∆ | ||||||||||
| Equity Turnover | 8.69 | 9.76 | -11.0 | % | ||||||||
| ROE | 77.0 | % | 56.7 | % | +2,030 | bps | ||||||
| ROTA | 18.5 | % | 11.0 | % | +750 | bps | ||||||
| ROA | 11.0 | % | 6.6 | % | +430 | bps | ||||||
| Dividend Yield | 10.69 | % | 6.88 | % | +381 | bps | ||||||
Leverage
Debt position primarily due to Jafra acquisition Remain committed to accelerated deleveraging.
| Q2 2024 | Q2 2023 | ∆ % | ||||||||||
| Debt to EBITDA | 1.95 | 2.31 | -15.6 | |||||||||
| Net Debt to EBITDA | 1.80 | 2.02 | -10.9 | |||||||||
| Interest Coverage | 3.22 | 2.65 | +21.5 | |||||||||
| * | Calculation of Dividend Yield Using the Closing Price on June
28, which was $14.61. |
4
Capital Allocation
Strategic Focus on Balance Sheet: BeFra’s balance sheet remains a strategic priority. The Company is on track to achieve its objective of decreasing Net Debt-to-EBITDA to at least 1.5x by the end of 2024. The Company’s Net Debt-to-EBITDA ratio as of June 30, 2024 was 1.8x, decreasing from 2.0x at the end of Q2 2023.
Sale of Jafra Mexico Headquarters: will result in an expected Ps. 34.1 M pesos in Q3 2024, with over Ps. 315 M to be collected over the next three years. Additionally, BeFra plans to sell another small property in Mexico City, previously used as employee parking, currently valued between Ps. 40 M and Ps. 50 M. All proceeds from these property sales will be allocated to servicing the Company’s outstanding debt.
Quarterly Dividends and Shareholder Value: the Company remains committed to enhancing shareholder value through quarterly dividends. BeFra’s board of directors approved a Ps. 250 M dividend for Q2 2024, representing the eighteenth consecutive quarterly dividend payment since the Company’s March 2020 IPO. Future dividends are expected to meet or exceed this quarter’s proposed amount, contingent upon BeFra’s financial performance and ongoing debt repayment plan.
2024 Guidance and Long-Term Growth Prospects
BeFra is well-positioned for a robust second half of the year. First half 2024 results, with net revenue and EBITDA aligned with the Company’s projections set at the beginning of the year, supports the Company’s current guidance, as detailed below:
| 2024 | 2023 | Var % | ||||||
| Net Revenue | $13,800 – 14,400 | $ | 13,010 | 6.1% - 10.7% | ||||
| EBITDA | $2,900 – 3,100 | $ | 2,721 | 6.6% - 13.9% | ||||
| * | Figures in millions Ps. |
5
Q2 2024 Financial Results by Business
Betterware Mexico
Key Financial and Operating Metrics
| Q2 | H1 | |||||||||||||||||||||||
| 2024 | 2023 | 2024 | 2023 | |||||||||||||||||||||
| Net Revenue | $ | 1,476,375 | $ | 1,444,406 | +2.2 | % | $ | 3,031,402 | $ | 2,833,389 | +7.0 | % | ||||||||||||
| Gross Margin | 56.4 | % | 61.8 | % | -538 | bps | 58.3 | % | 61.5 | % | -324 | bps | ||||||||||||
| EBITDA | $ | 304,467 | $ | 443,508 | -31.4 | % | $ | 686,574 | $ | 855,864 | -19.8 | % | ||||||||||||
| EBITDA Margin | 20.6 | % | 30.7 | % | -1,008 | bps | 22.6 | % | 30.2 | % | -756 | bps | ||||||||||||
| Associates | ||||||||||||||||||||||||
| Avg. Base | 713,144 | 753,743 | -5.4 | % | 714,895 | 753,160 | -5.1 | % | ||||||||||||||||
| EOP Base | 699,033 | 756,637 | -7.6 | % | 699,033 | 756,637 | -7.6 | % | ||||||||||||||||
| Monthly Activity Rate | 66.4 | % | 66.7 | % | -33 | bps | 67.04 | % | 67.4 | % | -37 | bps | ||||||||||||
| Avg. Monthly Order | $ | 2,027 | $ | 1,877 | +8.0 | % | $ | 2,040 | $ | 1,822 | +11.9 | % | ||||||||||||
| Distributors | ||||||||||||||||||||||||
| Avg. Base | 44,953 | 40,825 | +10.1 | % | 43,920 | 39,927 | +10.0 | % | ||||||||||||||||
| EOP Base | 45,009 | 41,981 | +7.2 | % | 45,009 | 41,981 | +7.2 | % | ||||||||||||||||
| Monthly Activity Rate | 98.0 | % | 98.1 | % | -7 | bps | 98.3 | % | 98.3 | % | -3 | bps | ||||||||||||
| Avg. Monthly Order | $ | 21,669 | $ | 23,440 | -7.6 | % | $ | 22,626 | $ | 23,500 | -3.7 | % | ||||||||||||
Highlights
| ● | Slight YoY Net Revenue increase despite inability to fully capture increased demand. Third consecutive quarter of YoY increase in Net Revenue (+2.2%), and 7.0% YoY increase for H1 2024, despite decreased sellout of some key SKUs in Q2 2024. Decreased sellout during the quarter was due to China-Mexico sea route supply chain disruptions and inaccurate demand forecasting for certain key products. The estimated net revenue loss during the quarter exceeded Ps. 300 M as Betterware’s most productive Distributors and Associates reduced their activity due to lack of desired product availability, resulting in abandoned orders. Excluding the quarter’s decreased sellout effect, the Company would have achieved double-digit growth. Betterware Mexico has since implemented measures to mitigate this in the future. |
| - | Product innovation, merchandising, and in-person field management strategies significantly contributed to stable performance during the quarter, reflected in growth within nearly all categories. |
| ● | Strengthened monthly purchases despite lack of Associate Base growth. Q2 2024 average order per Associate increased by 8.0% YoY, enabling increased share of wallet. |
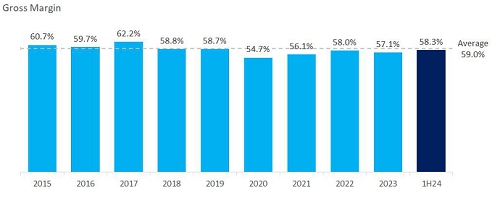
| ● | Addressing Gross Margin challenges. Decreased Q2 2024 gross margin was primarily due to higher import taxes on 116 Betterware SKUs, which increased by an average of 17%, higher international freight costs resulting from the Middle East conflict, a surge in China to Mexico shipment demand, also with slight sales mix misalignment towards less profitable items. |
| - | Notably, gross margin has remained stable for the past 10 years, averaging 59.0% despite exchange rate and freight rate volatility. |
| - | The Company has regained margin strength and stability, achieving a 58.3% gross margin for the first half of 2024 after considerable 2020 and 2021 challenges. The Company remains committed to maintaining long-term margin stability to achieve its 58%-59% average gross margin target established at the beginning of 2024. |
6
| ● | Short term EBITDA margin decrease. Q2 2024 EBITDA decreased by 10 pp, primarily due to a gross margin contraction, lower-than-expected net revenue, and slightly higher distribution costs during the quarter. Betterware anticipates returning to 26% EBITDA margin levels in the second half of 2024. |
| ● | Decreased inventory levels. Excess inventory decreased to $232M during the quarter, from $360M, with continued declines expected as the Company remains focused on achieving further inventory reductions. |
H2 2024 Priorities
| ● | Product Innovation: the Company’s robust innovation plan for H2 2024 is set to continue delivering strong results. |
| ● | Demand Forecasting: continued enhancement of forecasting models to mitigate stockouts. |
| ● | Cost Control: recalibrating merchandising plans to achieve expected revenue growth and profitability despite import taxes and freight cost effects. |
| ● | Pricing Strategy: new pricing position within marketing team to develop more effective pricing structures that enhance market share and profitability. |
| ● | Inventory Reduction: implementing strategies to further reduce excess inventory of specific SKUs. |
| ● | Incentive Program: refined our core incentive program to promote Associates’ activity and retention. |
International Expansion
| ● | Initial Launch of Betterware US. Pilot phase focuses on growth strategies in three Texas cities (Dallas, San Antonio and McAllen). If successful, this will transition from the pilot phase in the second half of the year. |
| ● | Betterware Peru Continued Progress Towards H1 2025 Launch. Similar dynamics to the Mexico market enables Betterware to leverage its considerable market experience. |
7
Jafra Mexico
Key Financial and Operating Metrics
| Q2 | H1 | |||||||||||||||||||||||
| 2024 | 2023 | 2024 | 2023 | |||||||||||||||||||||
| Net Revenue | $ | 1,671,137 | $ | 1,536,775 | +8.7 | % | $ | 3,521,133 | $ | 3,199,180 | +10.1 | % | ||||||||||||
| Gross Margin | 86.0 | % | 83.3 | % | +267 | bps | 85.5 | % | 82.6 | % | +286 | bps | ||||||||||||
| EBITDA | $ | 344,478 | $ | 268,724 | +28.2 | % | $ | 727,598 | $ | 546,271 | +33.2 | % | ||||||||||||
| EBITDA Margin | 20.6 | % | 17.5 | % | +313 | bps | 20.7 | % | 17.1 | % | +356 | bps | ||||||||||||
| Associates | ||||||||||||||||||||||||
| Avg. Base | 432,450 | 427,289 | +1.2 | % | 450,870 | 438,136 | +2.9 | % | ||||||||||||||||
| EOP Base | 419,931 | 424,435 | -1.1 | % | 419,931 | 424,435 | -1.1 | % | ||||||||||||||||
| Monthly Activity Rate | 50.5 | % | 51.2 | % | -70 | bps | 52.2 | % | 51.5 | % | +70 | bps | ||||||||||||
| Avg. Monthly Order | $ | 2,284 | $ | 2,091 | +9.2 | % | $ | 2,261 | $ | 2,077 | +8.9 | % | ||||||||||||
| Distributors | ||||||||||||||||||||||||
| Avg. Base | 19,073 | 18,853 | +1.2 | % | 18,913 | 18,942 | -0.2 | % | ||||||||||||||||
| EOP Base | 19,035 | 18,721 | +1.7 | % | 19,035 | 18,721 | +1.7 | % | ||||||||||||||||
| Monthly Activity Rate | 93.1 | % | 94.0 | % | -87 | bps | 94.6 | % | 94.2 | % | +42 | bps | ||||||||||||
| Avg. Monthly Order | $ | 2,693 | $ | 2,463 | +9.3 | % | $ | 2,545 | $ | 2,361 | +7.8 | % | ||||||||||||
Highlights
| ● | Double-digit net revenue increase in H1 2024: 8.7% and 10.1% YoY increase for the quarter and first half, respectively. Jafra has effectively capitalized on continued strength in the beauty market by replicating Betterware’s core growth model while leveraging the new management team’s leadership strength. Notably, H1 2024 growth was predominantly driven by volume (70%) rather than price (30%). |
| - | Color and Skincare categories led second quarter growth, achieving a 12% year on year increase, a 9% increase in Fragrance and a 5% increase in Toiletries. |
| ● | Slight increase in average Associate base, purchase per Associate continues to strengthen. YTD associate base increase of 2.9%, reaching 52.2% in activity levels and an 8.9% increase in average order value, YoY. The Company anticipates a recovery as well as an increase in both the Associate base and order value metrics, as Jafra still has significant potential for increased home penetration. |
| ● | Gross margin exceeds expectation. 267 bps increase in Q2 2024 gross margin driven by higher production volume and a favorable higher margin product sales mix (a 127 bps increase), lower material costs (91 bps decrease), and a 52 bps decrease in obsolescence expense. Gross margin improved by 286 bps YTD, due to the same factors. |
| ● | Outstanding EBITDA growth. Q2 2024 EBITDA increased by 28.2% YoY, with a 313 bps EBITDA margin increase favorably impacted by revenue growth during the quarter with stable gross margins and expense controls throughout the organization. |
| ● | Inventory levels. Inventory remained stable during the quarter, primarily due to a strengthened innovation model which drove revenue increases but also generated excess inventory, representing continued opportunities to improve demand forecasting for regular line items. Inventory levels are expected to normalize as Jafra further refines and recalibrates demand forecasting while implementing strategies to reduce excess inventory. |
H2 2024 Priorities
| ● | Product Innovation Plan: Implement comprehensive product innovation plan across all categories. |
| ● | Catalog Design: Launch a new and improved catalogue design featuring a cleaner and more engaging layout to drive purchases. |
| ● | Merchandising Plan: Begin implementing a more effective merchandising plan, including enhanced pricing and promotion strategies as well as improved pagination management. | |
| ● | Inventory Reduction: Continue executing plans to decrease inventory levels. |
8
Jafra US Key
Financial and Operating Metrics
| Q2 | H1 | |||||||||||||||||||||||
| 2024 | 2023 | 2024 | 2023 | |||||||||||||||||||||
| Net Revenue | $ | 241,881 | $ | 238,919 | +1.2 | % | $ | 439,361 | $ | 451,739 | -2.7 | % | ||||||||||||
| Gross Margin | 73.6 | % | 77.8 | % | -416 | bps | 73.8 | % | 77.2 | % | -338 | bps | ||||||||||||
| EBITDA | $ | 7,192 | $ | 5,201 | +38.3 | % | $ | -2,646 | $ | -30,143 | +91.2 | % | ||||||||||||
| EBITDA Margin | 3.0 | % | 2.6 | % | +77 | bps | -0.6 | % | -6.7 | % | +610 | bps | ||||||||||||
| Associates | ||||||||||||||||||||||||
| Avg. Base | 30,864 | 28,541 | +8.1 | % | 30,185 | 28,970 | +4.2 | % | ||||||||||||||||
| EOP Base | 31,026 | 29,921 | +3.7 | % | 31,026 | 29,335 | +3.7 | % | ||||||||||||||||
| Monthly Activity Rate | 46.7 | % | 44.4 | % | +233 | bps | 44.6 | % | 41.1 | % | +350 | bps | ||||||||||||
| Avg. Monthly Order | $ | 232 | $ | 236 | -1.2 | % | $ | 228 | $ | 234 | -2.5 | % | ||||||||||||
| Distributors | ||||||||||||||||||||||||
| Avg. Base | 1,726 | 2,041 | -15.4 | % | 1,727 | 2,061 | -16.2 | % | ||||||||||||||||
| EOP Base | 1,766 | 1,760 | +0.3 | % | 1,766 | 1,930 | +0.3 | % | ||||||||||||||||
| Monthly Activity Rate | 90.7 | % | 83.8 | % | +697 | bps | 89.5 | % | 82.45 | % | +707 | bps | ||||||||||||
| Avg. Monthly Order | $ | 229 | $ | 220 | +4.1 | % | $ | 223 | $ | 220 | +1.6 | % | ||||||||||||
Highlights
| ● | 1.2% YoY Net Revenue Increase - first net revenue increase since Jafra US acquisition. Reflects strong “back to growth” momentum, representing a 4.4% YoY increase in USD terms and a 9.1% YoY increase excluding an “extraordinary positive cut-off effect” on Q2 2023 net revenue. Notably, net revenue increased by a significant 16% in June, primarily driven by an expanding Associate base, also enabled by: |
| - | Baseline commercial model implemented at Jafra US in early 2024 has proven highly relevant to the US market. |
| - | Catalog pagination and design, effective incentivization, and stronger Distributor relationships drove sales growth during the quarter. |
| - | US revenue mix is now more evenly distributed across categories, presenting future growth opportunities across all markets. |
| - | While the Company had initially anticipated YoY net revenue growth and break-even by the second half of 2024, a strong first half has enabled BeFra to meet growth objectives and generate positive EBITDA ahead of schedule. |
| ● | Associate Base expansion. Associate base increased by 3.7% YoY for the first time since the Jafra US acquisition. Jafra US sales will be primarily driven by Associate base expansion due to current low market penetration. |
| ● | Positive EBITDA. Q2 2024 EBITDA increased by 38.3% YoY. Achieved near break-even in H1 2024 with continued progress to end the year with positive EBITDA, enabling future self-sustaining growth. |
H2 2024 Priorities
| ● | Product Innovation Plan: Implement comprehensive product innovation plan across all categories. |
| ● | Catalog Design: July catalog upgrades expected to favorably impact H2 2024. |
| ● | Merchandising Plan: Begin roll out of initial version of a more effective merchandising plan, including better pricing and promotion strategies with better-managed pagination. |
| ● | Launch Shopify+: new platform launch in August 2024 to capture increased share of online/digital demand in both the Hispanic and General Markets. This platform will also enhance the Sales Force experience, with increased motivation and support. |
| ● | Field Strategy: Field strategy revamp, similar to Betterware Mexico, to better prepare and motivate sales force. |
9
Appendix
Financial Statements
Betterware de México, S.A.P.I. de C.V.
Consolidated Statements of Final Position
As of June 30, 2024 and 2023
(In Thousands of Mexican Pesos)
| June 2024 | June 2023 | |||||||
| Assets | ||||||||
| Cash and cash equivalents | 423,246 | 728,872 | ||||||
| Trade accounts receivable, net | 1,082,224 | 1,166,267 | ||||||
| Accounts receivable from related parties | 542 | 30 | ||||||
| Inventories | 2,062,733 | 2,021,738 | ||||||
| Prepaid expenses | 137,214 | 126,859 | ||||||
| Income tax recoverable | 137,936 | 213,784 | ||||||
| Derivative Financial Instruments | 22,593 | - | ||||||
| Other assets | 121,204 | 163,131 | ||||||
| Total current assets | 3,987,692 | 4,420,681 | ||||||
| Property, plant and equipment, net | 2,919,620 | 2,902,039 | ||||||
| Right of use assets, net | 319,892 | 357,831 | ||||||
| Deferred income tax | 523,568 | 319,157 | ||||||
| Investment in subsidiaries | - | 1,236 | ||||||
| Intangible assets, net | 1,610,915 | 1,691,781 | ||||||
| Goodwill | 1,599,718 | 1,599,718 | ||||||
| Other assets | 56,888 | 50,934 | ||||||
| Total non-current assets | 7,030,601 | 6,922,696 | ||||||
| Total assets | 11,018,293 | 11,343,377 | ||||||
| Liabilities and Stockholders’ Equity | ||||||||
| Short term debt and borrowings | 589,478 | 754,232 | ||||||
| Accounts payable to suppliers | 1,949,182 | 1,721,562 | ||||||
| Accrued expenses | 358,363 | 357,052 | ||||||
| Provisions | 709,902 | 788,698 | ||||||
| Income tax payable | - | - | ||||||
| Value added tax payable | 92,532 | 132,688 | ||||||
| Trade accounts payable to related parties | 47,412 | 116,932 | ||||||
| Statutory employee profit sharing | - | 77,489 | ||||||
| Lease liability | 113,267 | 79,309 | ||||||
| Derivative financial instruments | - | 80,066 | ||||||
| Total current liabilities | 3,860,136 | 4,108,028 | ||||||
| Employee benefits | 133,626 | 154,817 | ||||||
| Derivative financial instruments | - | - | ||||||
| Deferred income tax | 783,169 | 837,672 | ||||||
| Lease liability | 230,721 | 281,447 | ||||||
| Long term debt and borrowings | 4,455,638 | 4,685,437 | ||||||
| Total non-current liabilities | 5,603,154 | 5,959,373 | ||||||
| Total liabilities | 9,463,290 | 10,067,401 | ||||||
| Stockholders’ Equity | ||||||||
| Capital stock | 321,312 | 321,312 | ||||||
| Share premium account | -25,264 | -16,370 | ||||||
| Retained earnings | 1,284,785 | 976,795 | ||||||
| Other comprehensive income | -24,275 | -3,984 | ||||||
| Non-controlling interest | -1,555 | -1,776 | ||||||
| Total Stockholders’ Equity | 1,555,003 | 1,275,977 | ||||||
| Total Liabilities and Stockholders’ Equity | 11,018,293 | 11,343,377 | ||||||
10
Betterware de México, S.A.P.I. de C.V.
Consolidated Statements of Profit or Loss and Other Comprehensive Income
For the three-months ended June 30, 2024 and 2023
(In Thousands of Mexican Pesos)
| Q2 2024 | Q2 2023 | ∆% | ||||||||||
| Net revenue | 3,389,393 | 3,220,097 | 5.3 | % | ||||||||
| Cost of sales | 940,918 | 860,763 | 9.3 | % | ||||||||
| Gross profit | 2,448,475 | 2,359,334 | 3.8 | % | ||||||||
| Administrative expenses | 772,840 | 742,747 | 4.1 | % | ||||||||
| Selling expenses | 950,176 | 838,525 | 13.3 | % | ||||||||
| Distribution expenses | 167,582 | 153,189 | 9.4 | % | ||||||||
| Total expenses | 1,890,598 | 1,734,461 | 9.0 | % | ||||||||
| Share of results of subsidiaries | - | - | - | |||||||||
| Operating income | 557,877 | 624,873 | -10.7 | % | ||||||||
| Interest expense | -170,833 | -206,173 | -17.1 | % | ||||||||
| Interest income | 11,565 | 14,994 | -22.9 | % | ||||||||
| Unrealized loss in valuation of financial derivative instruments | 95,295 | -14,521 | -756.3 | % | ||||||||
| Foreign exchange gain (loss), net | -40,212 | -38,535 | 4.4 | % | ||||||||
| Financing cost, net | -104,185 | -244,235 | -57.3 | % | ||||||||
| Income before income taxes | 453,692 | 380,637 | 19.2 | % | ||||||||
| Income taxes | 152,999 | 125,412 | 22.0 | % | ||||||||
| Net income including minority interest | 300,693 | 255,225 | 17.8 | % | ||||||||
| Non-controlling interest loss | 75 | 3,145 | -97.6 | % | ||||||||
| Net income | 300,768 | 258,370 | 16.4 | % | ||||||||
| EBITDA breakdown (Ps. million) | ||||||||||||
| Concept | Q2 2024 | Q2 2023 | ∆% | |||||||||
| Net income | 300,693 | 255,225 | 17.8 | % | ||||||||
| (+) Income taxes | 152,999 | 125,412 | 22.0 | % | ||||||||
| (+) Financing cost, net | 104,185 | 244,235 | -57.3 | % | ||||||||
| (+) Depreciation and amortization | 98,259 | 92,560 | 6.2 | % | ||||||||
| EBITDA | 656,136 | 717,433 | -8.5 | % | ||||||||
| EBITDA Margin | 19.4 | % | 22.3 | % | ||||||||
11
Betterware de México, S.A.P.I. de C.V.
Consolidated Statements of Profit or Loss and Other Comprehensive Income
For the six-months ended June 30, 2024 and 2023
(In Thousands of Mexican Pesos)
| H1 2024 | H1 2023 | ∆% | ||||||||||
| Net revenue | 6,991,896 | 6,484,308 | 7.8 | % | ||||||||
| Cost of sales | 1,892,473 | 1,748,747 | 8.2 | % | ||||||||
| Gross profit | 5,099,423 | 4,735,561 | 7.7 | % | ||||||||
| Administrative expenses | 1,558,456 | 1,567,507 | -0.6 | % | ||||||||
| Selling expenses | 1,978,750 | 1,683,999 | 17.5 | % | ||||||||
| Distribution expenses | 344,307 | 298,366 | 15.4 | % | ||||||||
| Total expenses | 3,881,513 | 3,549,872 | 9.3 | % | ||||||||
| Share of results of subsidiaries | - | - | - | |||||||||
| Operating income | 1,217,910 | 1,185,689 | 2.7 | % | ||||||||
| Interest expense | -327,827 | -417,108 | -19.6 | % | ||||||||
| Interest income | 10,803 | 27,488 | -33.7 | % | ||||||||
| Unrealized loss in valuation of financial derivative instruments | 70,513 | -64,737 | -208.9 | % | ||||||||
| Foreign exchange gain (loss), net | -61,253 | -49,108 | 24.7 | % | ||||||||
| Financing cost, net | -307,764 | -503,465 | -38.9 | % | ||||||||
| Income before income taxes | 910,146 | 682,223 | 33.4 | % | ||||||||
| Income taxes | 315,208 | 238,769 | 32.0 | % | ||||||||
| Net income including minority interest | 594,938 | 443,454 | 34.2 | % | ||||||||
| Non-controlling interest loss | -24 | 2,913 | -100.8 | % | ||||||||
| Net income | 594,914 | 446,367 | 33.3 | % | ||||||||
| EBITDA breakdown (Ps. million) | ||||||||||||
| Concept | H1 2024 | H1 2023 | ∆% | |||||||||
| Net income | 594,938 | 443,454 | 34.2 | % | ||||||||
| (+) Income taxes | 315,208 | 238,769 | 32.0 | % | ||||||||
| (+) Financing cost, net | 307,764 | 503,465 | -38.9 | % | ||||||||
| (+) Depreciation and amortization | 193,616 | 186,304 | 3.9 | % | ||||||||
| EBITDA | 1,411,526 | 1,371,993 | 2.9 | % | ||||||||
| EBITDA Margin | 20.2 | % | 21.2 | % | ||||||||
12
Betterware de México, S.A.P.I. de C.V.
Consolidated Statements of Cash Flows
For the three-months ended June 30, 2024 and 2023
(In Thousands of Mexican Pesos)
| Q2 2024 | Q2 2023 | |||||||
| Cash flows from operating activities: | ||||||||
| Profit for the period | 594,938 | 443,454 | ||||||
| Adjustments for: | ||||||||
| Income tax expense recognized in profit of the year | 315,208 | 238,769 | ||||||
| Depreciation and amortization of non-current assets | 193,616 | 186,304 | ||||||
| Interest income recognized in profit or loss | -10,803 | -27,488 | ||||||
| Interest expense recognized in profit or loss | 327,827 | 417,108 | ||||||
| Unrealized loss in valuation of financial derivative instruments | -70,513 | 64,737 | ||||||
| Share-based payment expense | -8,894 | -3,699 | ||||||
| Gain on disposal of equipment | -2,653 | -2,358 | ||||||
| Currency effect | -7,754 | -6,066 | ||||||
| Movements in not- controlling interest | 52 | -46 | ||||||
| Other gains and losses | - | - | ||||||
| Movements in working capital: | ||||||||
| Trade accounts receivable | -9,769 | -195,205 | ||||||
| Trade accounts receivable from related parties | -438 | 31 | ||||||
| Inventory, net | -28,599 | 100,932 | ||||||
| Prepaid expenses and other assets | 50,602 | -53,423 | ||||||
| Accounts payable to suppliers and accrued expenses | 196,116 | 405,293 | ||||||
| Provisions | -94,846 | -4,573 | ||||||
| Value added tax payable | -25,829 | 43,546 | ||||||
| Statutory employee profit sharing | -85,443 | -57,809 | ||||||
| Trade accounts payable to related parties | - | 20,073 | ||||||
| Income taxes paid | -421,733 | -251,738 | ||||||
| Employee benefits | 6,476 | 910 | ||||||
| Net cash generated by operating activities | 917,561 | 1,318,752 | ||||||
| Cash flows from investing activities: | ||||||||
| Investment in subsidiaries | - | - | ||||||
| Payments for property, plant and equipment, net | -106,532 | -26,349 | ||||||
| Proceeds from disposal of property, plant and equipment, net | 7,063 | 12,644 | ||||||
| Interest received | 10,803 | 27,488 | ||||||
| Net cash (used) generated in investing activities | -88,666 | 13,783 | ||||||
| Cash flows from financing activities: | ||||||||
| Repayment of borrowings | -1,175,000 | -1,600,000 | ||||||
| Proceeds from borrowings | 1,090,000 | 875,000 | ||||||
| Interest paid | -299,621 | -383,769 | ||||||
| Bond issuance costs | - | - | ||||||
| Lease payment | -71,731 | -61,025 | ||||||
| Share repurchases | - | - | ||||||
| Dividends paid | -499,027 | -249,513 | ||||||
| Net cash used in financing activities | -955,379 | -1,419,307 | ||||||
| Net decrease in cash and cash equivalents | -126,484 | -86,772 | ||||||
| Cash and cash equivalents at the beginning of the period | 549,730 | 815,644 | ||||||
| Cash and cash equivalents at the end of the period | 423,246 | 728,872 | ||||||
13
Key Operating Metrics
Betterware Mexico
| Q1 2023 | Q2 2023 | Q3 2023 | Q4 2023 | Q1 2024 | Q2 2024 | |||||||||||||||||||
| Associates | ||||||||||||||||||||||||
| Avg. Base | 752,577 | 753,743 | 768,042 | 756,250 | 716,645 | 713,144 | ||||||||||||||||||
| EOP Base | 764,024 | 756,637 | 759,310 | 741,170 | 724,707 | 699,033 | ||||||||||||||||||
| Monthly Activity Rate | 68.1 | % | 66.7 | % | 65.2 | % | 66.0 | % | 67.7 | % | 66.4 | % | ||||||||||||
| Avg. Monthly Order | $ | 1,767 | $ | 1,877 | $ | 1,823 | $ | 1,959 | $ | 2,052 | $ | 2,027 | ||||||||||||
| Monthly Growth Rate | 15.0 | % | 15.2 | % | 15.7 | % | 14.9 | % | 15.1 | % | 13.8 | % | ||||||||||||
| Monthly Churn Rate | 15.6 | % | 15.5 | % | 15.5 | % | 15.7 | % | 15.8 | % | 15.0 | % | ||||||||||||
| Distributors | ||||||||||||||||||||||||
| Avg. Base | 39,028 | 40,825 | 42,551 | 42,369 | 42,886 | 44,953 | ||||||||||||||||||
| EOP Base | 39,991 | 41,981 | 41,932 | 41,825 | 44,482 | 45,009 | ||||||||||||||||||
| Monthly Activity Rate | 98.5 | % | 98.1 | % | 97.9 | % | 98.1 | % | 98.5 | % | 98.0 | % | ||||||||||||
| Avg. Monthly Order | $ | 23,562 | $ | 23,440 | $ | 21,944 | $ | 23,518 | $ | 23,582 | $ | 21,669 | ||||||||||||
| Monthly Growth Rate | 9.1 | % | 10.7 | % | 10.4 | % | 9.9 | % | 11.8 | % | 11.4 | % | ||||||||||||
| Monthly Churn Rate | 8.6 | % | 9.1 | % | 10.4 | % | 10.0 | % | 9.7 | % | 11.0 | % | ||||||||||||
Jafra Mexico
| Q1 2023 | Q2 2023 | Q3 2023 | Q4 2023 | Q1 2024 | Q2 2024 | |||||||||||||||||||
| Associates | ||||||||||||||||||||||||
| Avg. Base | 448,982 | 427,289 | 414,968 | 461,712 | 469,290 | 432,450 | ||||||||||||||||||
| EOP Base | 427,280 | 424,435 | 422,956 | 467,736 | 451,692 | 419,931 | ||||||||||||||||||
| Monthly Activity Rate | 51.7 | % | 51.2 | % | 52.2 | % | 52.9 | % | 53.7 | % | 50.5 | % | ||||||||||||
| Avg. Monthly Order | $ | 2,063 | $ | 2,091 | $ | 2,088 | $ | 2,181 | $ | 2,238 | $ | 2,284 | ||||||||||||
| Monthly Growth Rate | 9.2 | % | 8.9 | % | 10.5 | % | 11.5 | % | 9.5 | % | 8.4 | % | ||||||||||||
| Monthly Churn Rate | 11.3 | % | 9.1 | % | 10.6 | % | 8.3 | % | 10.6 | % | 10.8 | % | ||||||||||||
| Distributors | ||||||||||||||||||||||||
| Avg. Base | 19,030 | 18,853 | 18,553 | 18,576 | 18,927 | 19,073 | ||||||||||||||||||
| EOP Base | 18,952 | 18,721 | 18,555 | 18,719 | 19,159 | 19,035 | ||||||||||||||||||
| Monthly Activity Rate | 94.5 | % | 94.0 | % | 94.0 | % | 95.3 | % | 96.0 | % | 93.1 | % | ||||||||||||
| Avg. Monthly Order | $ | 2,259 | $ | 2,463 | $ | 2,236 | $ | 2,624 | $ | 2,396 | $ | 2,693 | ||||||||||||
| Monthly Growth Rate | 1.0 | % | 1.0 | % | 1.1 | % | 1.4 | % | 1.6 | % | 0.7 | % | ||||||||||||
| Monthly Churn Rate | 1.6 | % | 1.4 | % | 1.4 | % | 1.1 | % | 0.8 | % | 0.8 | % | ||||||||||||
Jafra US
| Q1 2023 | Q2 2023 | Q3 2023 | Q4 2023 | Q1 2024 | Q2 2024 | |||||||||||||||||||
| Associates | ||||||||||||||||||||||||
| Avg. Base | 29,399 | 28,541 | 29,608 | 31,268 | 29,506 | 30,864 | ||||||||||||||||||
| EOP Base | 28,749 | 29,921 | 30,489 | 31,117 | 29,470 | 31,026 | ||||||||||||||||||
| Monthly Activity Rate | 37.7 | % | 44.4 | % | 45.1 | % | 43.8 | % | 42.4 | % | 46.7 | % | ||||||||||||
| Avg. Monthly Order (USD) | $ | 232 | $ | 235 | $ | 228 | $ | 231 | $ | 223 | $ | 232 | ||||||||||||
| Monthly Growth Rate | 9.7 | % | 12.9 | % | 14.5 | % | 12.5 | % | 11.3 | % | 14.4 | % | ||||||||||||
| Monthly Churn Rate | 15.0 | % | 11.5 | % | 13.8 | % | 11.5 | % | 13.1 | % | 12.5 | % | ||||||||||||
| Distributors | ||||||||||||||||||||||||
| Avg. Base | 2,080 | 2,041 | 1,642 | 1,782 | 1,728 | 1,726 | ||||||||||||||||||
| EOP Base | 2,099 | 1,760 | 1,645 | 1,793 | 1,674 | 1,766 | ||||||||||||||||||
| Monthly Activity Rate | 81.1 | % | 83.8 | % | 90.4 | % | 90.2 | % | 88.3 | % | 90.7 | % | ||||||||||||
| Avg. Monthly Order (USD) | $ | 219 | $ | 220 | $ | 217 | $ | 215 | $ | 217 | $ | 229 | ||||||||||||
| Monthly Growth Rate | 1.9 | % | 2.6 | % | 6.3 | % | 7.9 | % | 4.6 | % | 8.5 | % | ||||||||||||
| Monthly Churn Rate | 1.8 | % | 7.6 | % | 8.4 | % | 5.0 | % | 6.9 | % | 6.7 | % | ||||||||||||
14
Key Financial Metrics
Consolidated
| Q1 2023 | Q2 2023 | Q3 2023 | Q4 2023 | Q1 2024 | Q2 2024 | |||||||||||||||||||
| Net Revenue | $ | 3,264,211 | $ | 3,220,097 | $ | 3,123,507 | $ | 3,401,692 | $ | 3,602,503 | $ | 3,389,393 | ||||||||||||
| Gross Margin | 72.8 | % | 73.3 | % | 70.2 | % | 70.0 | % | 73.6 | % | 72.2 | % | ||||||||||||
| EBITDA | $ | 654,559 | $ | 717,433 | $ | 529,424 | $ | 819,484 | $ | 755,390 | $ | 656,136 | ||||||||||||
| EBITDA Margin | 20.1 | % | 22.3 | % | 16.9 | % | 24.1 | % | 21.0 | % | 19.4 | % | ||||||||||||
| Net Income | $ | 187,996 | $ | 258,370 | $ | 196,991 | $ | 406,104 | $ | 294,146 | $ | 300,768 | ||||||||||||
| Free Cash Flow | $ | 549,311 | $ | 1,305,046 | $ | 1,643,327 | $ | 2,256,395 | $ | 359,655 | $ | 818,092 | ||||||||||||
Betterware Mexico
| Q1 2023 | Q2 2023 | Q3 2023 | Q4 2023 | Q1 2024 | Q2 2024 | |||||||||||||||||||
| Net Revenue | $ | 1,388,983 | $ | 1,444,406 | $ | 1,420,739 | $ | 1,472,480 | $ | 1,555,027 | $ | 1,476,375 | ||||||||||||
| Gross Margin | 61.1 | % | 61.8 | % | 56.2 | % | 50.2 | % | 60.0 | % | 56.4 | % | ||||||||||||
| EBITDA | $ | 412,356 | $ | 443,508 | $ | 328,295 | $ | 250,342 | $ | 382,107 | $ | 304,467 | ||||||||||||
| EBITDA Margin | 29.7 | % | 30.7 | % | 23.1 | % | 17.0 | % | 24.6 | % | 20.6 | % | ||||||||||||
Jafra Mexico
| Q1 2023 | Q2 2023 | Q3 2023 | Q4 2023 | Q1 2024 | Q2 2024 | |||||||||||||||||||
| Net Revenue | $ | 1,662,405 | $ | 1,536,775 | $ | 1,486,816 | $ | 1,668,956 | $ | 1,849,996 | $ | 1,671,137 | ||||||||||||
| Gross Margin | 82.0 | % | 83.3 | % | 83.0 | % | 86.5 | % | 85.0 | % | 86.0 | % | ||||||||||||
| EBITDA | $ | 277,547 | $ | 268,724 | $ | 207,985 | $ | 532,780 | $ | 383,120 | $ | 344,478 | ||||||||||||
| EBITDA Margin | 16.7 | % | 17.5 | % | 14.0 | % | 31.9 | % | 20.7 | % | 20.6 | % | ||||||||||||
Jafra US
| Q1 2023 | Q2 2023 | Q3 2023 | Q4 2023 | Q1 2024 | Q2 2024 | |||||||||||||||||||
| Net Revenue | $ | 212,823 | $ | 238,916 | $ | 215,952 | $ | 260,256 | $ | 197,480 | $ | 241,881 | ||||||||||||
| Gross Margin | 76.5 | % | 77.8 | % | 74.1 | % | 74.4 | % | 74.0 | % | 73.6 | % | ||||||||||||
| EBITDA | $ | -35,344 | $ | 5,201 | $ | -6,856 | $ | 36,361 | $ | -9,838 | $ | 7,192 | ||||||||||||
| EBITDA Margin | -16.6 | % | 2.2 | % | -3.2 | % | 14.0 | % | -5.0 | % | 3.0 | % | ||||||||||||
15
Use of Non-IFRS Financial Measures
This announcement includes certain references to EBITDA, EBITDA Margin, Net Debt:
EBITDA: defined as profit for the year adding back the depreciation of property, plant, and equipment and right of use assets, amortization of intangible assets, financing cost, net and total income taxes.
EBITDA Margin: is calculated by dividing EBITDA by net revenue.
EBITDA and EBITDA Margin are not measures recognized under IFRS and should not be considered as an alternative to, or more meaningful than, consolidated net income for the year as determined in accordance with IFRS or as indicators of our operating performance from continuing operations. Accordingly, readers are cautioned not to place undue reliance on this information and should note that these measures as calculated by the Company, may differ materially from similarly titled measures reported by other companies.
BeFra believes that these non-IFRS financial measures are useful to investors because (i) BeFra uses these measures to analyze its financial results internally and believes they represent a measure of operating profitability and (ii) these measures will serve investors to understand and evaluate BeFra’s EBITDA and provide more tools for their analysis as it makes BeFra’s results comparable to industry peers that also prepare these measures.
Definitions: Operating Metrics
From the Q2 2024 on, we will report our salesforce under the same name for all our business units, Distributors (previously stated as Leaders in Jafra) and Associates (previously stated as Consultants for Jafra). It is important to note that the metrics are calculated with the same method as previous quarters and the reference name change has no adverse effect in the results of the operating metrics reported by the Company.
Betterware (Associates and Distributors)
Avg. Base: Weekly average Associate/Distributor base
EOP Base: Associate/Distributor base at the end of the period
Weekly Churn Rate: Average weekly data. Total Associates/Distributors lost during the period divided by the beginning of the period Associate/Distributor base.
Weekly Activity Rate: Average weekly data. Active Associates/Distributors divided by ending Associate/Distributor base.
Avg. Weekly Order: Average weekly data. Total Revenue divided by number of active Associates/Distributors
Jafra (Associates and Distributors)
Avg. Base: Monthly average Associate/Distributor base
EOP Base: Associate/Distributor base at the end of the period
Monthly Churn Rate (Associates): Average monthly data. Total Associates lost during the period divided by the number of active Associates 4 months prior. An Associate is terminated only after 4 months of inactivity.
Monthly Churn Rate (Distributors): Average monthly data. Total Distributors lost during the period divided by end of period Distributors’ base.
Monthly Activity Rate: Average monthly data. Active Associate/Distributor divided by the end of period Associate/Distributor base.
Avg. Monthly Order (Associates): Average monthly data. Total Catalogue Revenue divided by number of Associates orders.
Avg. Monthly Order (Distributors): Average monthly data. Total Distributors Revenue divided by number of Distributors orders.
About Betterware de México, S.A.P.I. de C.V.
Founded in 1995, Betterware de Mexico is the leading direct-to-consumer company in Mexico focused on offering innovative products that solve specific needs related to household organization, practicality, space-saving, and hygiene. Through the acquisition of JAFRA on April 7, 2022, the Company now offers a leading brand of direct-to-consumer in the Beauty market in Mexico and the United States where it offers Fragrances, Color & Cosmetics, Skin Care, and Toiletries. The combined company possesses an asset-light business model with low capital expenditure requirements and a track record of strong profitability, double digit rates of revenue growth and free cash flow generation. Today, the Company distributes its products in Mexico and in the United States of America.
16
Forward-Looking Statements
This press release includes certain statements that are not historical facts but are forward-looking statements for purposes of the safe harbor provisions under the United States Private Securities Litigation Reform Act of 1995. Forward-looking statements generally are accompanied by words such as “believe,” “may,” “will”, “estimate”, “continue”, “anticipate”, “intend”, “expect”, “should”, “would”, “plan”, “predict”, “potential”, “seem”, “seek,” “future,” “outlook”, and similar expressions that predict or indicate future events or trends or that are not statements of historical matters. The reader should understand that the results obtained may differ from the projections contained in this document and that many factors could cause our actual activities or results to differ materially from the activities and results anticipated in forward looking statements. For this reason, the Company assumes no responsibility for any indirect factors or elements beyond its control that might occur inside Mexico or abroad and which might affect the outcome of these projections and encourages you to review the ‘Cautionary Statement’ and the ‘Risk Factor’ sections of our annual report on Form 20-F for the year ended December 31, 2020 and any of the Company’s other applicable filings with the Securities and Exchange Commission for additional information concerning factors that could cause those differences
The Company undertakes no obligation and does not intend to update these forward-looking statements to reflect events or circumstances occurring after the date hereof. You are cautioned not to place undue reliance on these forward-looking statements, which speak only as of the date hereof. Further information on risks and uncertainties that may affect the Company’s operations and financial performance, and the forward statements contained herein, is available in the Company’s filings with the SEC. All forward-looking statements are qualified in their entirety by this cautionary statement.
Q2 2024 Conference Call
Management will hold a conference call with investors on July 26th, 2024, at 7:00 am Mexico City Time / 9:00am Eastern Time (EST). For anyone who wishes to join live, the dial-in information is:
Toll Free: 1-877-451-6152
Toll/International: 1-201-389-0879
Conference ID: 13747694
If you wish to listen to the replay of the conference call, please see instructions below:
Toll Free: 1-844-512-2921
Toll/International: 1-412-317-6671
Replay Pin Number: 13747694
Contacts.
Company:
BeFra IR
ir@better.com.mx
+52 (33) 3836 0500 Ext. 2011
InspIR:
Investor Relations
Barbara Cano
barbara@inspirgroup.com
17